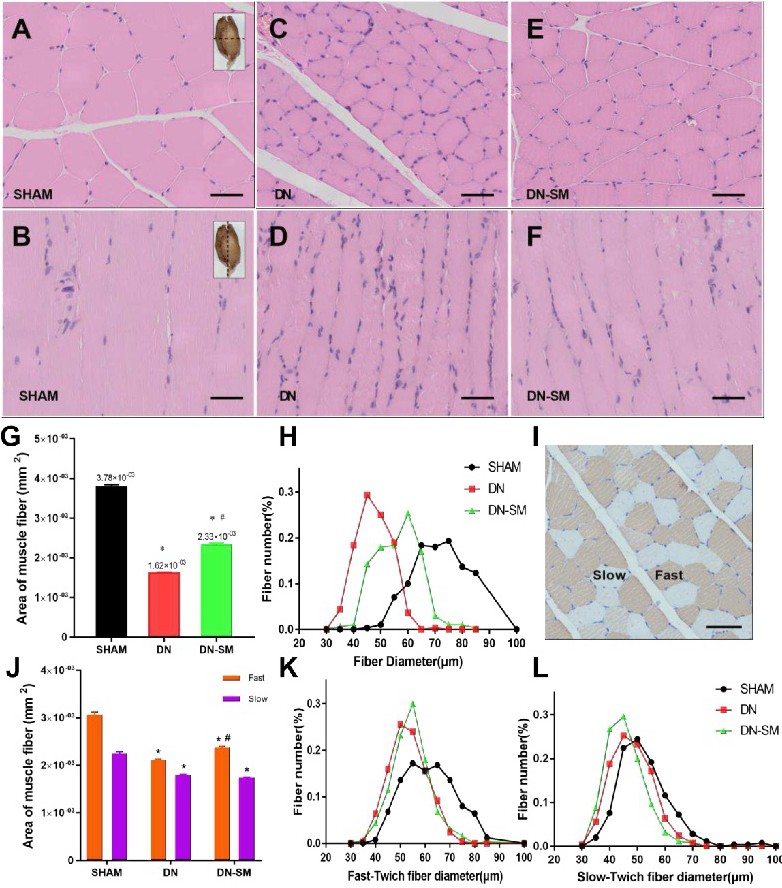
Fig. 1. Structure of the gastrocnemius muscle. (A-H) Representative H&E staining light graph showing the muscle fiber area (G) and diameter (H) (Scale bar = 100 μm, n = 6 per group). (I-L) Immunohistochemistry results showing the fast- and slow-type muscle fiber area and diameter, respectively (Scale bar = 100 μm, n = 6 per group). Data are presented as mean ± SEM. SHAM, sham operation; DN, denervation; DN-SM, denervation and electrical stimulation; *P<0.05, significantly different from SHAM; # P<0.05, significantly different from DN.